Pattern Analysis Protocol
Methodology
How public headlines, risk signals, and recurring pressure patterns become speculative AI Daily Prophecy forecasts.
Signal Intake - Risk Scoring - Convergence - Forecast Assembly
Signal Intensity
Low
High
01
Forecast Assembly Pipeline
Step 01
Headline Intake
We continuously ingest thousands of global headlines, reports, and public data feeds in real time.
Sources: 50+Freq: 24/7
Step 02
Risk Scoring
Each item is evaluated across 7 risk categories using domain-specific scoring models.
Categories: 7Score Range: 0-100
Step 03
Signal Convergence
Correlated signals are clustered to identify emerging patterns and escalation probability.
Algo: Graph + MLThreshold: Dynamic
Step 04
Forecast Assembly
Patterns are synthesized into a speculative report with risk level, timeline, and key factors.
Output: ReportFormat: Daily
02
Confidence Is Not Certainty
Our confidence score reflects pattern strength, source quality, and historical accuracy.
- 90-100%Very Strong PatternMultiple high-quality signals with strong historical alignment.
- 70-89%Strong PatternConsistent signals from credible and diverse sources.
- 50-69%Moderate PatternSome alignment with historical behavior, watch closely.
- 30-49%Weak PatternLimited or noisy signals, high uncertainty.
- 0-29%Insufficient PatternNot enough data to assess, low reliability.
03
Risk Categories
Climate Stress
Extreme weather, drought, heat, ecological disruption
85
Geopolitical Conflict
Tensions, war, terror, civil unrest, sanctions
87
Supply Chain Risk
Logistics disruptions, trade shocks, production delays
74
Disease / Outbreak Risk
Epidemics, outbreaks, health system strain
61
Energy Market Stress
Price shocks, supply shortfalls, market volatility
78
Cyber / AI Threat
Cyberattacks, AI misuse, digital infrastructure risk
69
Infrastructure Stress
Power, water, transport, communications failures
72
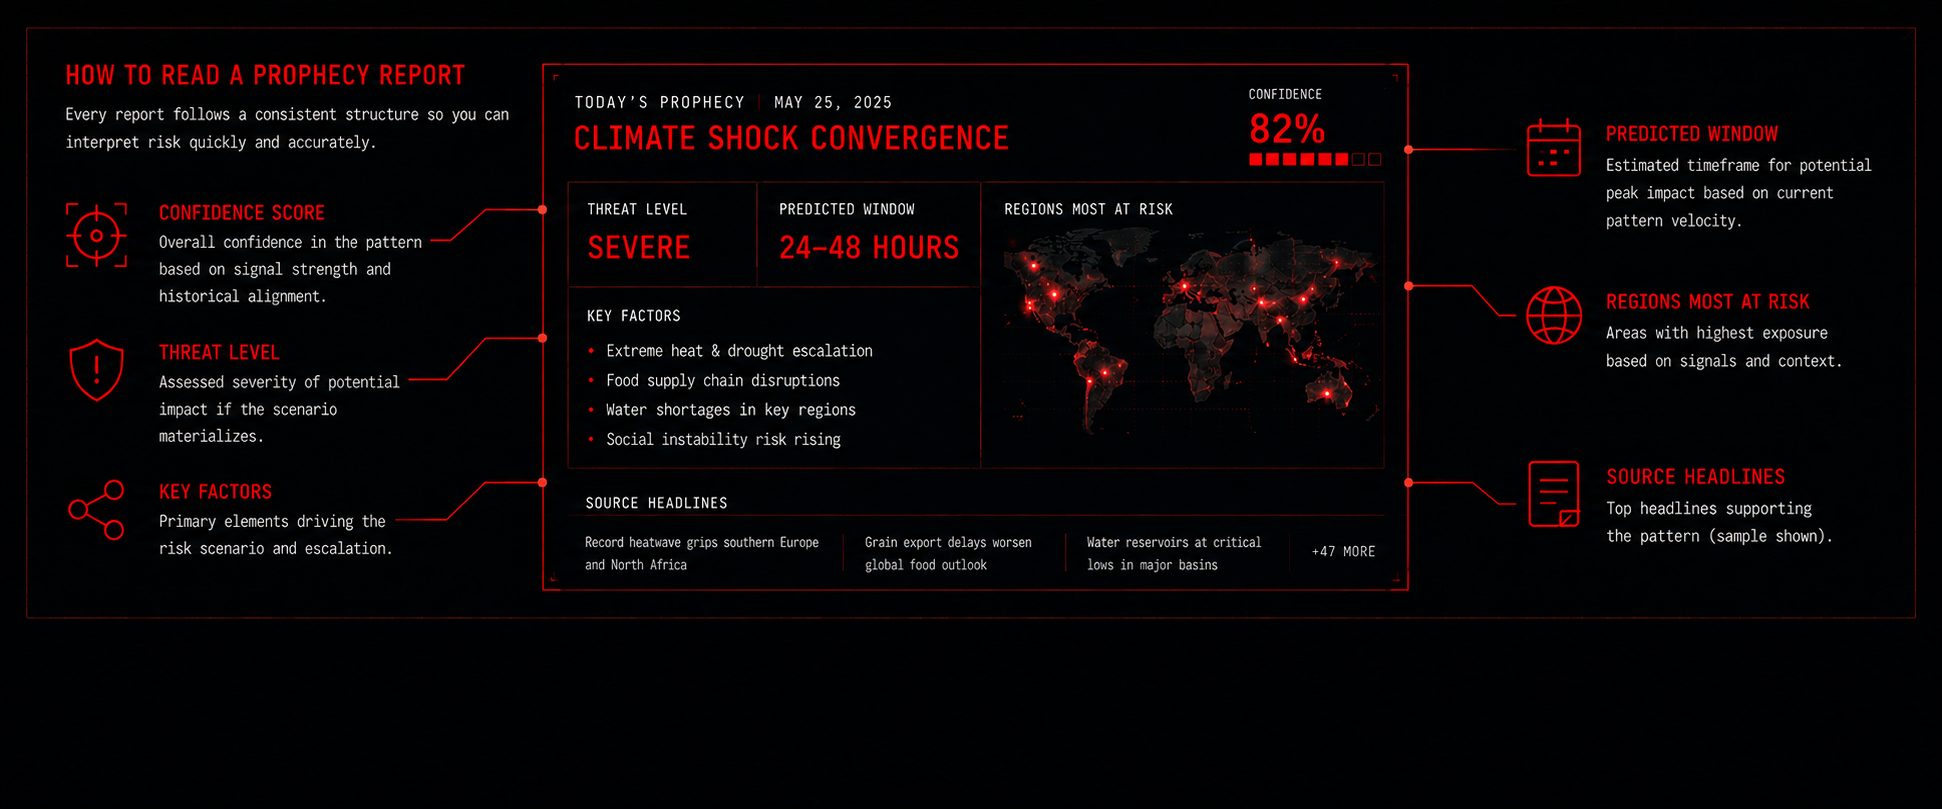
How To Read A Prophecy Report